Early Warning System for Revit: Catch Modeling Failures Early
May 20, 2025
Early Warning System for Revit: Catch Modeling Failures Early
Greetings! In this post, I’d like to outline how we built an internal monitor for Revit processes and learned to identify trouble before it turns into lost hours. This isn’t an academic paper. Consider it a practical field report, complete with numbers, setbacks, and wins.
An Idea Born of Frustration
How often does your Revit crash or hang at the worst possible moment? For us, it was a recurring mini-disaster. Each crash meant losing an hour or two of work (admittedly, not everyone saves every 30 minutes as Autodesk suggests). Every “Not Responding” prompt sparked the familiar office remark: “Revit froze again — time for coffee.” Eventually, firefighting grew old after the fact. We set out to anticipate problems instead of reacting to them.
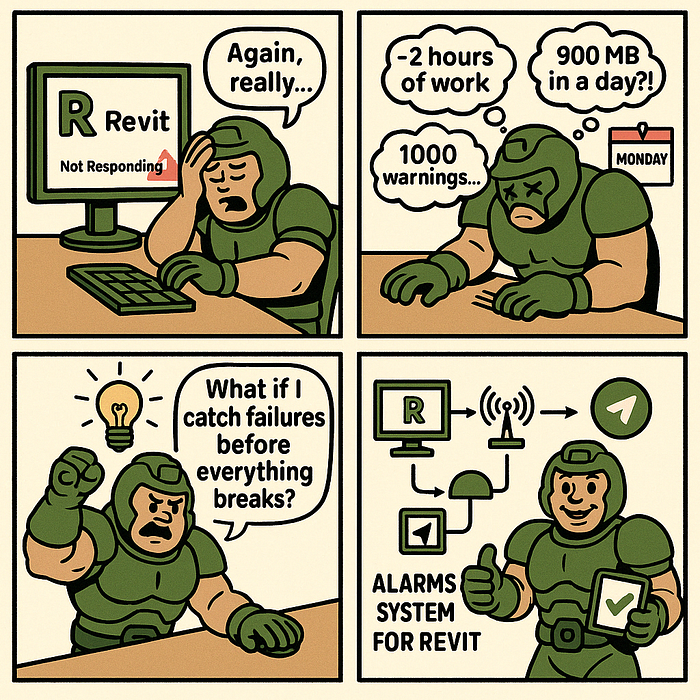
One morning, I was hit with three complaints at once: an architect’s Revit had crashed overnight, wiping out unsaved plans. Another model had swollen to 900 MB in a single day, and a third project had slowed to a crawl under a thousand warnings. That was the tipping point. I thought:
“What if we tracked these problems automatically and warned the team ahead of time?”
The goal was to set up an alarm system to catch the signs of an impending crash (or at least record it instantly) so we can rescue data and fix the issue before it snowballs.
That’s how the objective took shape: real-time Revit monitoring.
Imagine a “black box” on every workstation, sending an SOS the moment something looks off. Ambitious, but worth a try.
Why monitoring matters — our daily pain points
- Sudden freezes. Revit might lock up midday, leaving someone staring at a white window, hoping it unfreezes. Sometimes it did after five minutes, sometimes never. Time — and patience — evaporated.
- Crashes and data loss. Every so often, the app simply exited without saving. If a user hadn’t saved for a while (more common than Autodesk’s 30-minute advice suggests), an hour or more of work vanished instantly.
- Bloated, unhealthy models. Some projects ballooned to 700–800 MB with thousands of warnings. Performance tanked. Our rule of thumb: pass ~500 warnings and you’re courting trouble. Hit a thousand and you’re in the danger zone.
- Slow reaction time. By the time the team realised a model needed cleaning — because 3,000 warnings had piled up or the file size had exploded — the damage was already done.
All of this screamed for a proactive stance. Monitoring had to become our antidote: spot a spike in warnings or a sudden size jump and step in before the project stalls.
Tools of the trade: from PyRevit to Telegram
The concept was clear, but how to implement it?
Our first idea was a simple script that parses Revit journal files after each launch. But we wanted live feedback with zero manual log-digging, so we kept looking.

How the stack came together
- pyRevit — a Python add-in framework for Revit. It lets us run custom scripts inside Revit and pull out the metrics we need while the user is working.
- Proxy (local agent) — a lightweight service that runs on every workstation. It receives data from the pyRevit script, buffers it, and ships it to the server asynchronously. This way, Revit never waits on a slow or flaky network connection.
- FastAPI (server) — the central API (Python) that ingests data from all agents, processes it, and writes to the database. FastAPI is quick to build with, fast in production, and handles real-time traffic gracefully.
- PostgreSQL (DB) — our durable store for every metric. Familiar SQL makes ad-hoc analysis and reporting straightforward.
- Grafana (dashboard) — plugged into Postgres for visualisation. The team can open one page and see model health over time: warning count, file size, crash frequency, and more. No need to build a UI from scratch — Grafana excels at time-series data.
- Telegram bot — handles alerts. Grafana can send notifications to Telegram out of the box, but we wrote our bot so we could format messages in our style and add custom buttons for quick actions.
There are commercial tools like Autodesk Clarity that monitor 60-plus model parameters and even output a composite “health” score. But licences cost money, and building our system was both cheaper and more engaging. 🙂
Why didn’t we rely on PyRevit’s built-in telemetry system
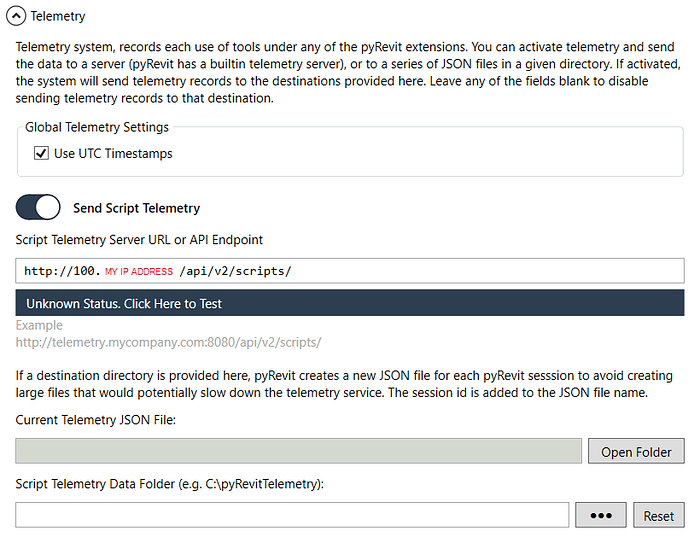
Why PyRevit’s built-in telemetry wasn’t enough
The built-in logger in pyRevit is great for local diagnostics: it writes usage data to a small SQLite file so you can see which commands ran, how often, and with what outcome. Our brief was different.
We needed a centralised monitoring pipeline — metrics streamed to a server, buffered on the client, alerted in Telegram, and visualised in Grafana. That meant controlling the event schema, attaching extra context (project name, user, timestamps), and running our business logic on top. In short, pyRevit’s telemetry is designed for single-workstation analytics, not fleet-wide observability. So we didn’t reject it — its scope just didn’t match ours.
Monitoring Architecture
Putting everything together, the architecture of our monitoring system looks like this:
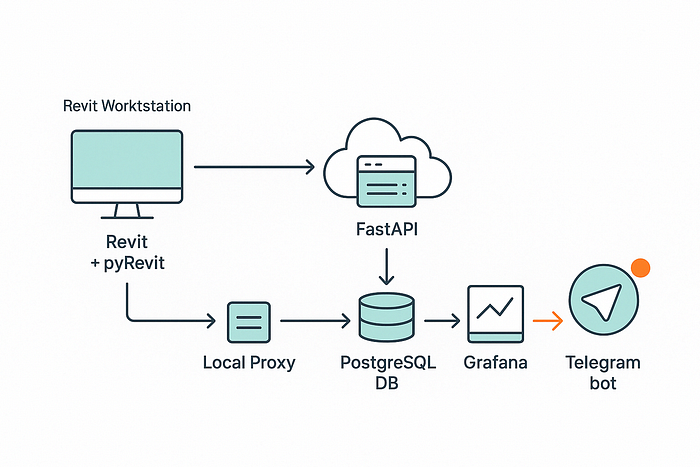
A pyRevit script runs inside Revit and periodically transmits key metrics (for example, the number of warnings, time since the last save, current model size, etc.) to the local Proxy.
The Proxy is a small web service on the user’s machine. It places the incoming data into a temporary queue. It then sends data packets to the central FastAPI service.
The server receives these metrics and writes them to the PostgreSQL database. Grafana connects to that database and continuously draws up-to-date charts. In parallel, logic within FastAPI analyses each batch: if anything falls outside acceptable limits (a critical signal), the server triggers the Telegram bot, which immediately sends an alert to the responsible team members.
This multi-layered setup didn’t appear overnight. At first, I tried to simplify things — sending data straight from PyRevit to the database, skipping the API. It quickly became clear we needed more flexibility and control. The API server lets us decide centrally what to do with each event (log it, trigger an alert, and so on). The local proxy, meanwhile, shields Revit from network hiccups that could otherwise slow the application to a crawl.
How we collect data: journals, logs, and scripts
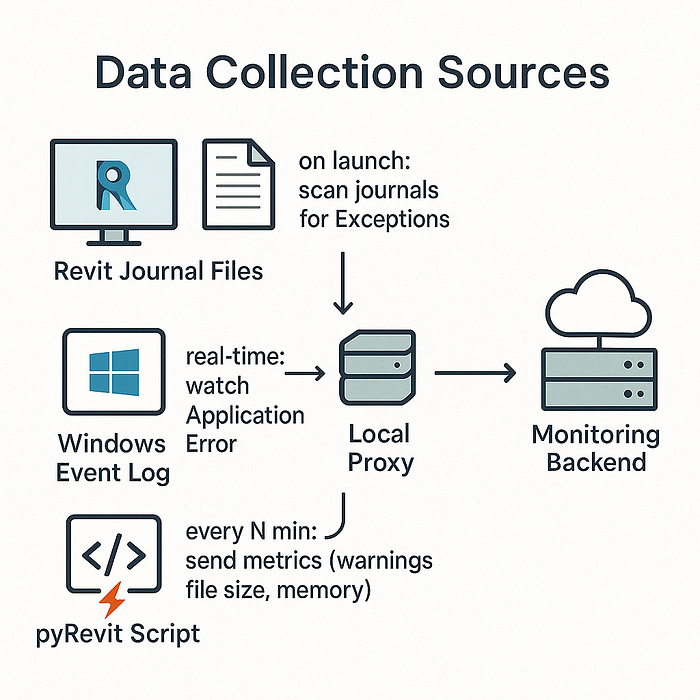
- Revit journals (journal files).
A detailed log of each Revit session's activity is written. These files reveal which commands ran, where errors occurred, and more—some enthusiasts even build user-activity timelines from them. We assumed that if Revit crashes, the session journal will hold clues: the last action, perhaps an error code. On every Revit start (or after a reboot), our service scans the latest journals for terms like “Exception” or other crash indicators. That gives us post-facto insight into failures. - Windows Event Log.
During a serious freeze or crash, Revit often creates a record in the Windows Event Log (e.g., Application Error or AppHang). The client-side proxy includes a small module that watches the Event Log. When it sees an Error from the Revit source, it immediately signals the server. This lets us capture the exact crash moment almost instantly, without waiting for the user to reopen Revit and send journals. - Embedded scripts (pyRevit).
The most valuable metrics come while Revit is running. Via the Revit API, we collect data such as the current number of warnings in the model, project file size, time since last save, RAM usage, and so on. Every N minutes, the PyRevit script sends this snapshot. We get the model’s pulse: warnings up by 200 in ten minutes, or the file growing 100 MB after a DWG import. We also catch the Revit close event, then immediately check whether the exit was clean or a crash, based on those same journals and the process return code.
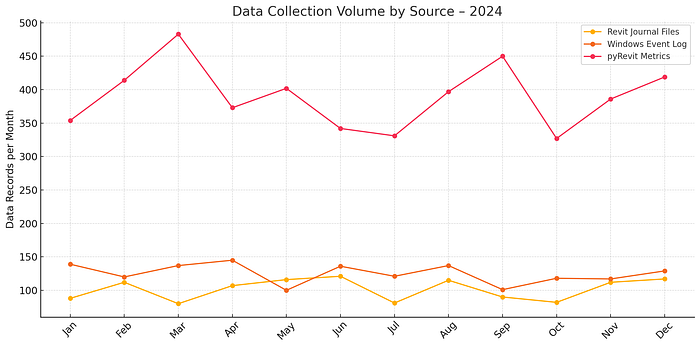
The blend of these data sources gives us a surprisingly complete picture. It took work — parsing journal-file formats, filtering the noisy Windows event stream — but the system now knows almost as much about Revit’s state as Revit itself.
What We Track
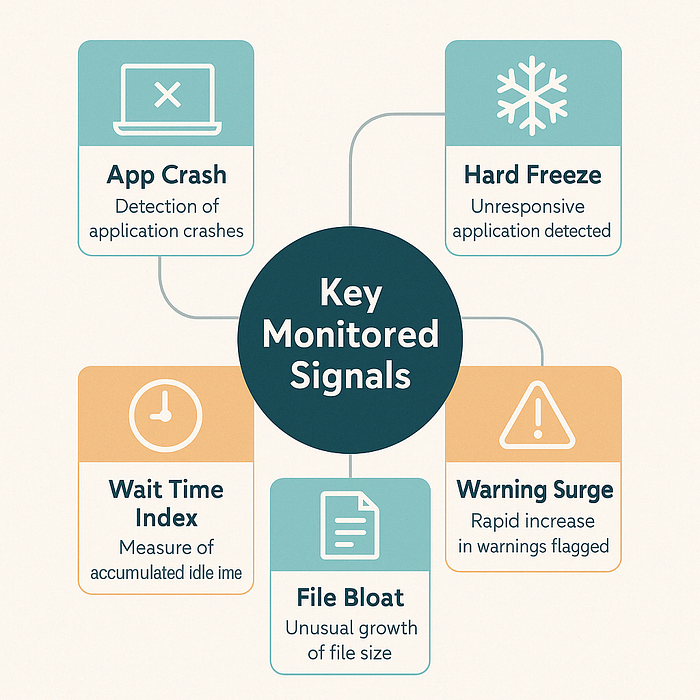
Which “warning bells” can we now catch? We settled on a core set of metrics and events:
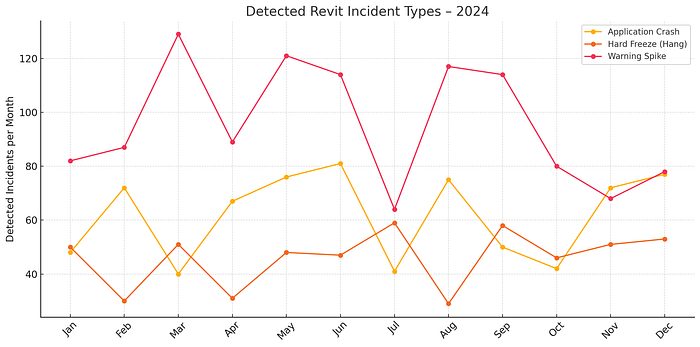
- Application crash — the most obvious one. When Revit crashes (detected via a journal entry or Windows Event Log), the server records the project, user, and timestamp instantly. We even classify the crash type — Fatal Error, silent crash-to-desktop, hang terminated by Task Manager, and so on.
- Hard freeze — Revit stops responding altogether. Our proxy infers this when the pyRevit script hasn’t reported in for more than X minutes, and an Application Hang appears in the Event Log. We treat that as a confirmed freeze. (Next step: have the agent query the process directly for a “Not Responding” state.)
- Sudden spike in warnings — the Warnings count metric. Thresholds are set — for example, >100 new warnings in an hour or >500 total in the model trigger an alert. A sharp jump often means someone copied a problematic element or imported a troublesome file, and the warnings snowballed. If you don’t clean this up quickly, the model becomes sluggish within days.
- Anomalous file growth — if a project file gains roughly 20 % in a single day, or keeps adding tens of megabytes for no clear reason, we raise a flag. It usually means someone imported a huge CAD file, or unused families are multiplying. Each night and morning, we record the central file’s size and plot a trend line. Any sharp jump triggers an investigation.
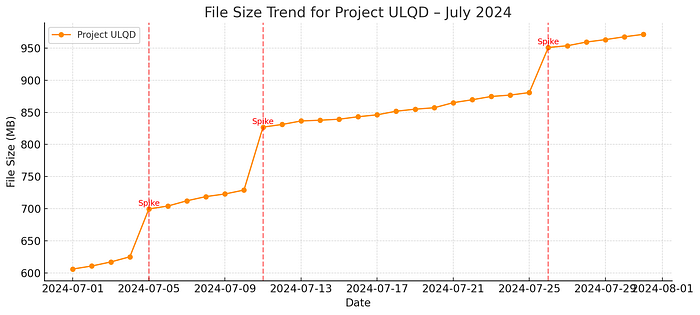
- Lag Index — an internal KPI we jokingly call “brain freeze.” It sums up how much time users collectively spend each day just waiting (when Revit isn’t responding). We derive it from journals: long pauses between logged actions, frequent auto-saves, or heavy sync operations all count toward lost time. This metric is mainly analytical — if, say, one team spent three hours last week staring at a frozen Revit window, we know the model’s performance needs attention.
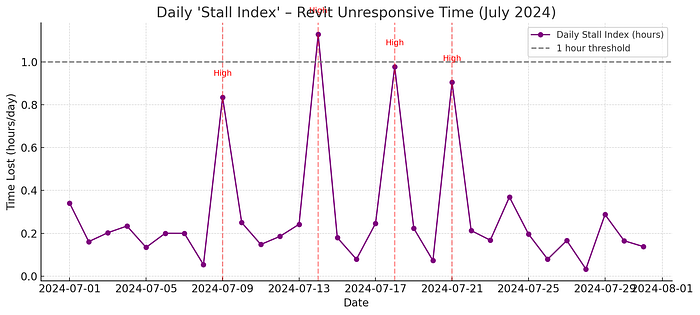
Naturally, we watch a few other signals as well — how often the model syncs to central, work-set errors, and niche warnings like “slightly off axis,” which can snowball into serious trouble. Still, the five metrics above get most of our attention.
It’s also worth stressing that not every incident triggers a full-blown alert. If Revit crashes once in the middle of the night because someone left it open, the bot pings only me — the BIM manager — so I can sort it out in the morning. A crash during core hours, on the other hand, goes out to the wider team. We tuned the system so it won’t become the proverbial boy who cried wolf.
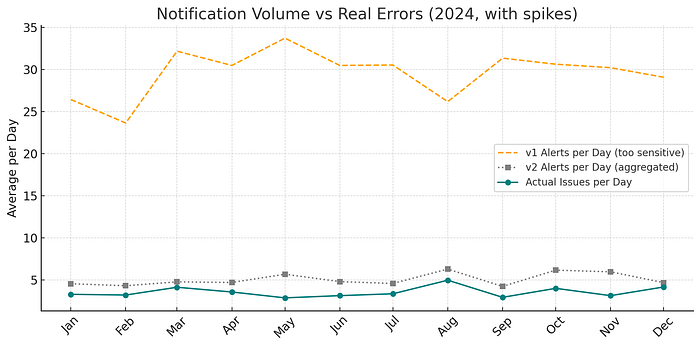
By the way, we learned a few amusing lessons along the way. My first monitoring setup was far too sensitive: the bot fired a notification every time the warning count rose by ten. When one model racked up about 300 warnings in a single day, we received 30 messages in a row! 🤦♂️
Colleagues first asked, “Who’s spamming the chat?” — then promptly muted the bot. We had to fix that fast: we introduced smarter thresholds and aggregation so alerts now appear only for genuinely important anomalies.
How the bot notifies in Telegram
When the system detects something unusual, our Telegram bot takes over. It’s integrated into the BIM team corporate chat. What does a message look like?
Imagine someone in the OfficeTower project duplicates a couple of thousand elements, triggering a wave of warnings. The bot immediately posts:
🔶 Project OfficeTower — warnings are rising too quickly!
1520 ⚠️ (was 1000 an hour ago) — the model may be in trouble.
Responsible: @petrov (ARCH)
Please review the latest changes.
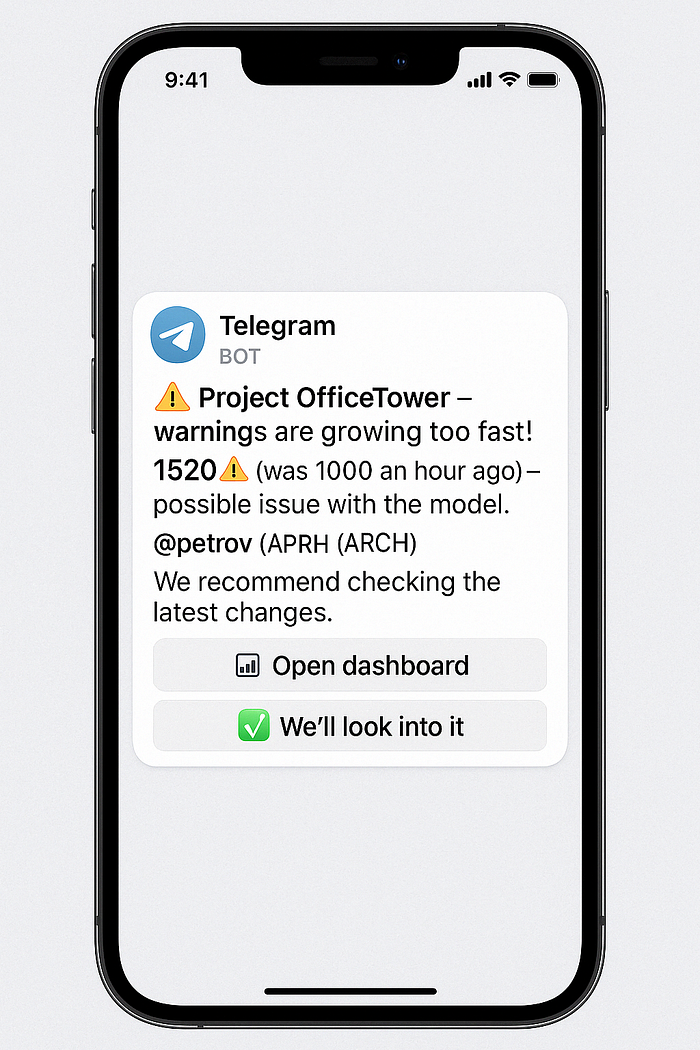
And right under that message, the bot adds interactive buttons:
- 📊 Open Dashboard — taps out a Grafana link for this project (for instance, a 24-hour warning-count chart so you can see the spike).
- ✅ We’ve Got It — marks the alert as acknowledged. When the responsible person clicks, the bot replies to the chat: “Acknowledged, the ARCH team will handle it,” and silences any repeat alerts on the same issue for the next N hours.
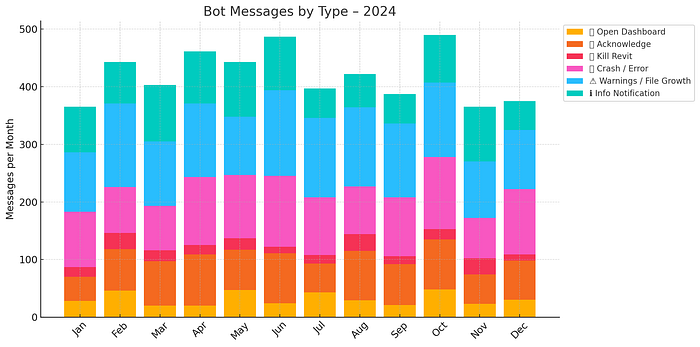
Another alert targets freezes. If Revit stays unresponsive for more than five minutes, the bot sends the user a direct message:
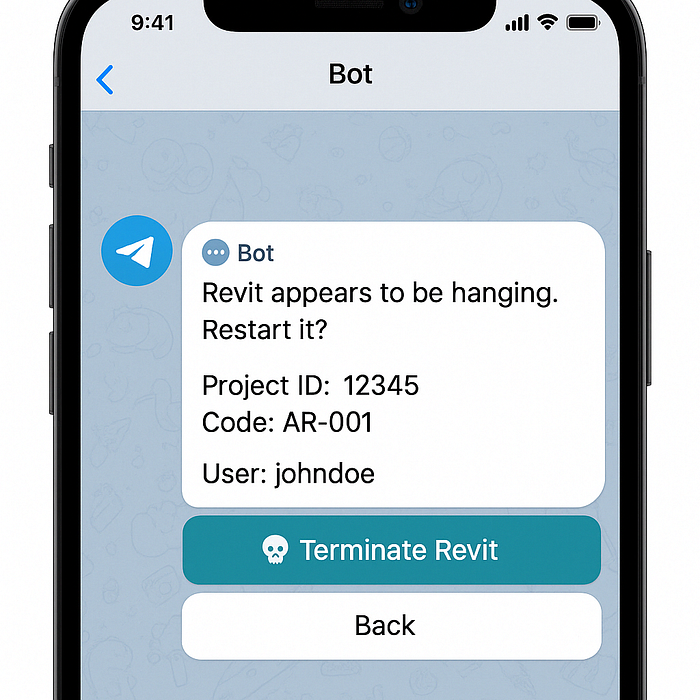
“Revit appears to be frozen. Restart?”
and displays a “💀 Kill Revit” button.
Yes — our agent can terminate the Revit process on demand, because after ten stubborn minutes, a clean restart is usually faster than waiting. The action runs only with the user’s explicit click, so it’s used sparingly. Internally, we’ve nicknamed the feature “Revit, die” — a light-hearted nod to Die Hard.
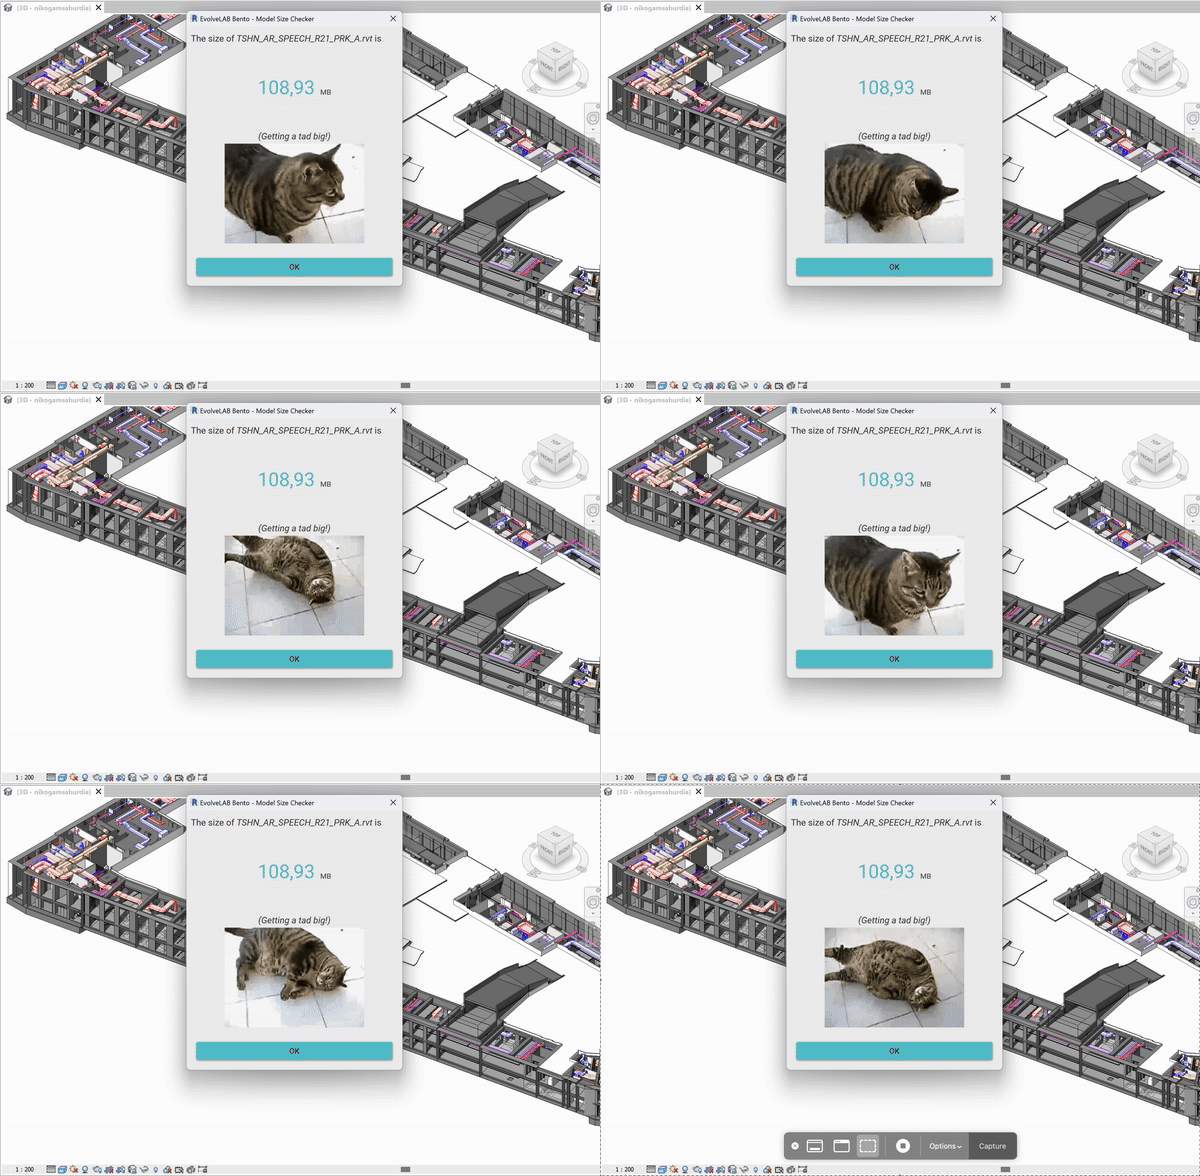
In general, we keep the message tone semi-formal and friendly. No over-the-top drama (“WARNING! CATASTROPHE!”), But not bone-dry either. The bot may crack the occasional joke: when a file swelled to a record 1.2 GB, it chimed in, “Whoa, the model just ballooned to 1,200 MB.” The team enjoyed the humour, but I make sure the jokes stay appropriate and harmless. I borrowed that line from EvolveLab and their “cat” memes — credit to them. Their humour felt perfectly on point for this scenario.
Of course, the rollout wasn’t flawless. We hit a few painful bumps along the way:
- A couple of times, the monitoring system itself became the culprit. The first version of the pyRevit script had a memory leak — ironically slowing down the very Revit instances it was meant to protect. We caught it and fixed it.
- The Telegram bot once slipped into an infinite notification loop due to an obscure bug, peppering the chat with identical messages. We had to disable the bot in a hurry and patch the logic.
We earned our bruises, but over time, everything settled down.
The Revit monitoring pays for itself. We can’t imagine working without it now. When the system is silent, it usually means everything is fine, and that peace of mind is invaluable. Projects reach the documentation phase with fewer fire drills because issues surface at an early stage.


